Do you live in an innovative city? The Brookings Institution recently released a study on metropolitan patent data. Among other things, the data includes the number of patents granted and the number of patents granted per job as an average over the last five years.
Which is the most innovative city?
The metropolitan area that generated the highest number of patents per year is San Jose, CA (Silicon Valley). No surprise there. Silicon Valley generated 10.3 patents per 1,000 jobs. No other area in the country comes close to this level of patent productivity. Nearby areas San Francisco, CA and Santa Cruz, CA came in 7th and 8th respectively.

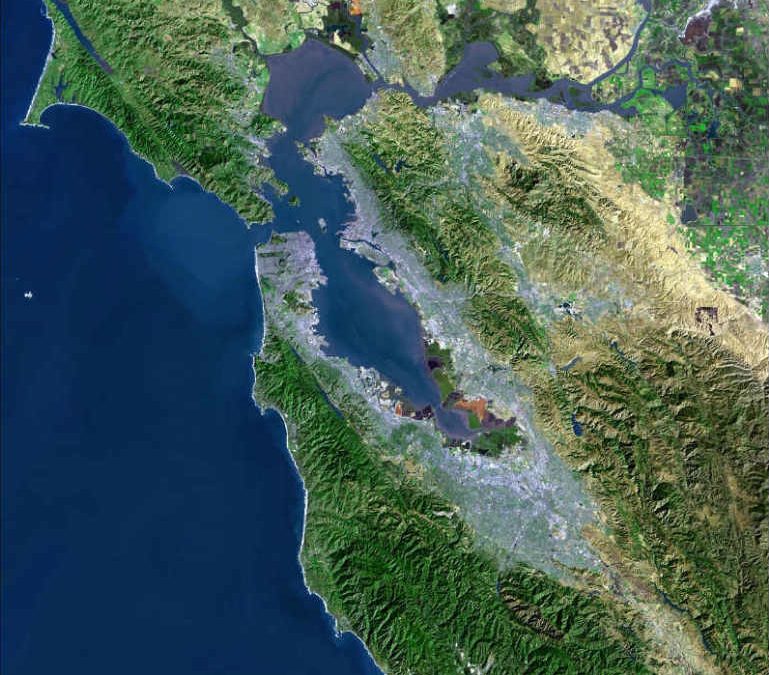
A satellite image of the San Francisco Bay Area. Silicon Valley is the most innovative metropolitan area.
Top Ten Metro Areas
| Rank | City | Average Annual Patents Granted | Patents per 1,000 Jobs |
| 1 | San Jose, CA | 9,237 | 10.3 |
| 2 | Burlington, VT | 826 | 6.86 |
| 3 | Rochester, MN | 606 | 5.70 |
| 4 | Corvallis, OR | 194 | 4.83 |
| 5 | Poughkeepsie, NY | 1,226 | 4.70 |
| 6 | Boulder, CO | 666 | 4.04 |
| 7 | San Francisco, CA | 7,003 | 3.59 |
| 8 | Santa Cruz, CA | 310 | 3.20 |
| 9 | Austin, TX | 2,497 | 3.09 |
| 10 | Ann Arbor, MI | 590 | 2.93 |
It is interesting that this list includes a number of metro areas that are relatively small, such as Burlington, VT and Rochester, MN. Many large cities, such as Los Angeles (56), Chicago (69) and New York (77) are far down the list. Therefore, size is not necessarily an advantage in patent productivity.
The Brookings Institution notes a number of factors that influence patent production. One of them is STEM education. STEM stands for science, technology, engineering and math. People educated in these fields are more likely to invent and patent than those trained in industries like finance and healthcare. Consequently, metropolitan areas with high rates of STEM educated workers tend to have a high rate of patent production.
How does Nevada Compare?
Reno compares favorably to other areas while Las Vegas lags far behind. Reno ranked 55th among all of the metropolitan areas in the study with 1 patent per 1,000 jobs. This is substantially higher than larger neighboring areas Sacramento, CA (rank 137) and Salt Lake City, UT (rank 91).
Reno and Las Vegas Compared to Other Selected Areas
| Rank | City | Average Annual Patents Granted | Patents per 1,000 Jobs |
| 1 | San Jose, CA | 9,237 | 10.3 |
| 7 | San Francisco, CA | 7,003 | 3.59 |
| 55 | Reno, NV | 199 | 1.0 |
| 76 | Phoenix, AZ | 1,437 | 0.8 |
| 91 | Salt Lake City, UT | 441 | 0.7 |
| 99 | Boise, ID | 175 | 0.7 |
| 137 | Sacramento, CA | 392 | 0.5 |
| 215 | Las Vegas, NV | 211 | 0.3 |
Las Vegas, on the other hand, ranked 215th with 0.3 patents per 1,000 jobs. Why did Reno rank so much higher than Las Vegas? Reno may have produced more patents because it leads Las Vegas in all of the following categories:
- Technology sector share of employment 2011
- Bachelor degree attainment rate 2011
- STEM Bachelor’s degree attainment rate 2011
- Number of Science PhD programs 2006
However, Sacramento and Salt Lake City surpassed Reno in all of these categories and yet Reno ranked higher. In fact, Reno ranked higher than many other areas that have better statistics in these categories. How could this be?
There is interesting reason why Reno may rank so high. We will explore this in a future article.