
Nevada Intellectual Property Application Index
© ATIP Law 2014
Nevada Intellectual Property Application Index 2014
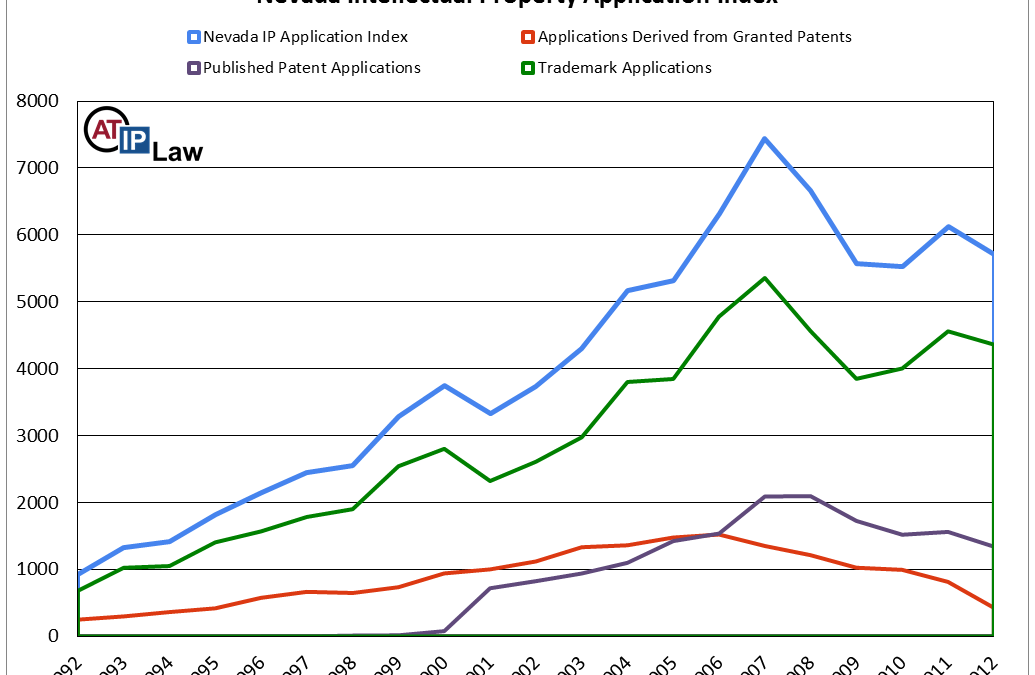
The Nevada Intellectual Property Application Index 2014 (NIPAI™ or Index) is provided in the chart above. As you can see, trademark applications rose 4% in 2013 from 4371 to 4543. This is good news for the State economy as it shows that new businesses are opening and new products and services are being developed.
The number of patent applications filed from the State of Nevada in the past year appears to be significantly less than the previous year (down 42%). However, this is due at least in part to publication lag and pendency lag. In the United States, data for each pending patent application is not publicly available until the application is published or it is granted as a patent.
Therefore, we are not able to count most patent applications filed in a given year until well after that year. Patent applications will be significantly under-counted in the most recent two years and the data will be revised upwards as new data become available.
Outlook
The indications for 2013 are good. The rise in trademark applications, data of which is not effected by secrecy or lags, has increased and this is a good sign for increasing strength in the State economy. We expect the NIPAI™ 2013, which is only down 7%, to be revised upward in future additions and we expect 2014 to be a good year for intellectual property filings.
Definitions
Index
The Index measures the volume of intellectual property applications submitted from the state of Nevada each year.
The NIPAI™ tracks patents and trademark applications by the year that they are filed. This edition of the Index includes data from 1993 to 2013.
A portion of the patent and trademark applications that are filed will be abandoned for various reasons. If you are interested in approved (granted or registered) intellectual property, please see the Nevada Intellectual Property Index.
Patents
The NIPAI™ includes patent applications that list an inventor, applicant or assignee that has a Nevada address. This provides an excellent measure of innovation and inventive activity in the State.
The NIPAI™ switches from one source of patent application data to another in the studied time period to provide a more accurate indication of application activity. Prior to the year 2000 U.S. patent applications were kept secret unless and until a patent was granted from the application. The U.S. Patent and Trademark Office began publishing patent applications in the year 2000. These two data sources can be seen in the Chart above.
From 1992 to 2005, the Index uses granted patents as its source of data. From 2006 onward, the index uses published patent applications. 2006 is the first year in which the number of published applications exceeded the number indicated by granted patents.
The Index does not include all patent applications. A few applicants elect not to publish their applications and a small number of applications are abandoned or withdrawn before publication. Nation wide, about 7% of all applications are not published.
Trademarks
Compared to the patent portion of the Index, the trademark portion is straight forward. The NIPAI™ includes the total number of trademark applications filed each year that indicate an owner with a Nevada address. This is an excellent indication of general economic activity and development of new businesses, products and services. Almost every kind of private business uses trademarks and new trademarks are filed when new businesses are started and new products or services are offered by established businesses.
In general, there is a small time lag between the time a trademark application is filed and the time it appears on the trademark database. However, this time lag should not significantly influence the Index. Nevertheless, the statistics produced by the trademark database do change over time and we expect that future additions of the NIPAI™ will include small revisions to the trademark data.
Copyrights
The NIPAI™ does not include copyright data because the Copyright Office does not provide application dates in its database. However, copyright applications have a lower average pendency and lower rate of abandonment than do patent and trademark applications. Therefore, the number of copyright applications filed in a year should be close to the number of copyright registrations for that year. To review copyright registration data, please see the Nevada Intellectual Property Index.
More Information
Please see these pages for more information:
Please contact us if we can be of assistance to you.