ATIP Law is happy to release the Nevada Intellectual Property Application Index (NIPAI™ or Index). The Index measures the volume of intellectual property applications submitted from the state of Nevada each year.
Chart

Nevada Intellectual Property Application Index
© ATIP Law 2013
A chart of the NIPAI™ and its components is provided below:
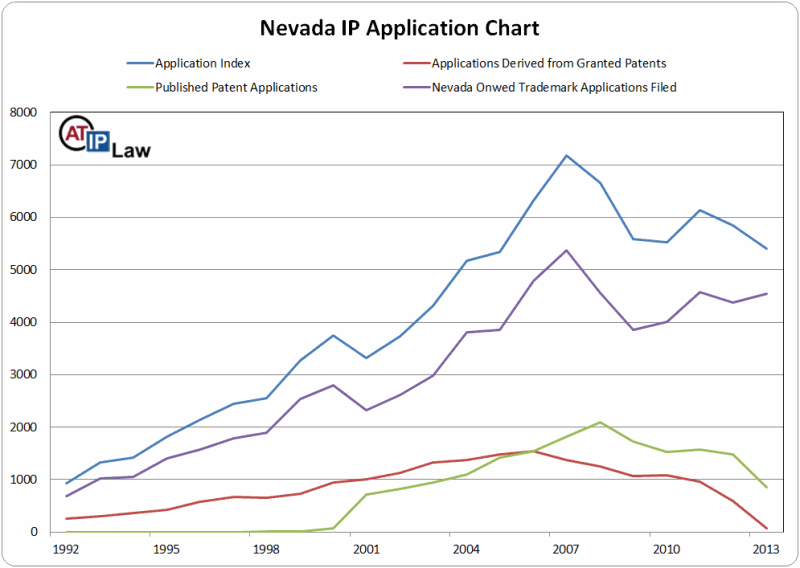
Nevada Intellectual Property Application Index
As seen in the chart above, the NIPAI™ enjoyed a steady upward trend from 1992 to 2000. The effects of the “dot-com bubble” were clearly felt in 2001 when the Index decreased 17%. Nevada bounced back quickly and the Index resumed an upward trend in 2002 until it peaked in 2007.
The “Great Recession” took hold in 2008 and the Index declined three straight years; the biggest drop being 16% in 2009. In 2011 the NIPAI™ increased 14% and last year finished down by 4%. However, due to patent publication time lag discussed below, we believe the Index will be revised upward for 2011 and 2012 as new data becomes available.
Outlook
We predict that the Index will increase significantly in 2013. Although the economy has been improving slowly in Nevada, we believe that intellectual property investments are outpacing the economy. Nevada companies appear to be developing more intellectual property.
Definitions
The NIPAI™ tracks patents and trademark applications by the year that they are filed. This edition of the Index includes data from 1992 to 2012.
A portion of the patent and trademark applications that are filed will be abandoned for various reasons. If you are interested in approved (granted or registered) intellectual property, please see the Nevada Intellectual Property Index.
Patents
The NIPAI™ includes patent applications that list an inventor or assignee that is located in Nevada. This provides an excellent measure of innovation and inventive activity in the State.
The NIPAI™ switches from one source of patent application data to another in the studied time period to provide a more accurate indication of application activity. Prior to the year 2000 U.S. patent applications were kept secret unless and until a patent was granted from the application. In accordance with changes in patent laws, the U.S. Patent and Trademark Office began publishing patent applications in the year 2000. These two data sources can be seen in the Chart above.
From 1992 to 2005, the Index uses granted patents as its source of data. From 2006 onward, the index uses published patent applications. 2006 is the first year in which the number of published applications exceeded the number indicated by granted patents.
There is a time lag between the time an application is filed and the time it is published. In general, an application is published 18 months after its first priority date. Therefore, the last two years of the patent portion of NIPAI™ are likely to be revised upward in future editions of the Index. We expect 2012 patent applications to be revised upward into positive territory as new data is released.
A few applicants elect not to publish their applications and a small number of applications are abandoned or withdrawn before publication. Nation wide, about 7% of all applications are not published. Therefore, the Index does not include all patent applications.
Trademarks
Compared to the patent portion of the Index, the trademark portion is straight forward. The NIPAI™ includes the total number of trademark applications filed each year that indicate a Nevada owner. This is an excellent indication of general economic activity and development of new businesses, products and services. Almost every kind of business uses trademarks and new trademarks are filed when new businesses are started and new products or services are offered by established businesses.
There is a small time lag between the time a trademark application is filed and the time it appears on the trademark database. However, this time lag should not significantly influence the Index. Nevertheless, the statistics produced by the trademark database do change over time and we expect that future additions of the NIPAI™ will include small revisions to the trademark data.
Copyrights
The NIPAI™ does not include copyright data because the Copyright Office does not provide application dates in its database. However, copyright applications have a lower average pendency and rate of abandonment than do patent and trademark applications. Therefore, the number of copyright applications filed in a year should be close to the number of copyright registrations for that year. To review copyright registration data, please see the Nevada Intellectual Property Index.